The subsurface conditions in Waterloo shift dramatically depending on which side of the city you're on. Up near the Laurel Creek moraine, you'll hit dense till packed with cobbles and boulders within a few metres. Down in the Parkdale area closer to the Grand River valley, the overburden thins out and the dolostone bedrock gets riddled with solution channels. These contrasts aren't academic. They dictate foundation costs, excavation methods, and whether you'll need to budget for karst mitigation. Seismic tomography gives us the cross-sectional velocity map needed to see these transitions before breaking ground. We run both refraction and reflection lines depending on the target depth and site access constraints. For deeper bedrock mapping on the moraine where the till runs 15 to 25 metres thick, we typically deploy a 48-channel spread with a weight-drop source to get clean first arrivals. The velocity contrasts between dense lodgement till and weathered Guelph Formation dolostone are sharp enough to resolve to sub-metre accuracy. On tight urban sites near Uptown Waterloo, we shift to a sledgehammer source and shorter geophone spacing to keep the survey footprint small while still capturing critical stratigraphic boundaries. A seismic refraction survey configured for tomography delivers the continuous velocity profile that borehole logs alone can miss, especially where lateral variability is high.
A 2D velocity cross-section from seismic tomography can reveal a site class change across 15 metres of lateral distance that two boreholes spaced 30 metres apart would completely miss.
Service characteristics in Waterloo Ontario
Risks and considerations in Waterloo Ontario
Southern Ontario weather doesn't give you a long survey window. From November through March the ground freezes to depths of 40 to 60 centimetres in Waterloo, and frozen till screws up seismic coupling at the surface. We push fieldwork into the April-to-October season whenever possible. The bigger operational risk is karst. The Silurian dolostone underlying most of Waterloo is prone to dissolution along joint sets, creating voids and soil pipes that can collapse under foundation loads. Seismic tomography picks these up as velocity shadows, zones where the expected 4,000+ m/s bedrock velocity drops below 2,000 m/s. But interpreting these shadows takes experience. A velocity drop can also come from a deeply weathered bedrock surface rather than an open void. We cross-reference the seismic data with borehole logs and aerial photo lineament analysis to distinguish between the two. The buried bedrock valleys that run through the region add another layer of complexity. These channels filled with low-velocity sand and silt can be 30 metres deep or more, and missing their edges means mischaracterizing the site class entirely. Running a tomographic line perpendicular to the suspected valley axis gives us the clearest image of the valley walls and the velocity contrast at the till-bedrock interface.
Our services
We configure every seismic tomography survey to the specific geological question the project raises. For most Waterloo sites, this means one of two deployment strategies.
Refraction Tomography for Site Classification and Bedrock Mapping
This is our standard survey for determining Vs30 and mapping the overburden-bedrock interface. We lay out a 48-channel spread with 4.5 Hz geophones at 3-metre spacing, using a weight-drop source at multiple offset positions to build a dense ray coverage. The inversion produces a 2D P-wave velocity cross-section that we convert to shear-wave velocity using regional Poisson's ratio values calibrated to on-site borehole data. The output feeds directly into NBCC site class determination and foundation design parameters.
Combined Refraction-Reflection Tomography for Karst Detection
When borehole data or desktop studies indicate karst potential in the Guelph Formation dolostone, we run a hybrid survey that captures both refracted and reflected wavefields. The refraction data images the overburden and top-of-bedrock, while the reflection processing illuminates intra-bedrock structure down to 80 metres or more. We use a longer spread and higher-energy source to boost the reflected signal. The final deliverable includes a depth-migrated reflection section overlaid with the velocity tomogram, giving you a complete picture of bedrock integrity and any velocity anomalies that could indicate voids, fractures, or soil-filled conduits.
Frequently asked questions
What does a seismic tomography survey cost for a typical Waterloo residential or commercial lot?
For most single-lot surveys in Waterloo, the cost ranges from CA$3,440 to CA$6,450 depending on line length, target depth, and whether we're running refraction only or a combined refraction-reflection spread. A standard refraction tomography line 70 metres long with a 48-channel setup falls in the middle of that range. Deeper reflection surveys or multi-line grids push toward the upper end. Every quote includes data processing, interpretation, and a signed report with velocity cross-sections.
Can seismic tomography see karst voids in the Waterloo bedrock?
Yes, it's one of the primary reasons we run these surveys here. An air-filled or water-filled void produces a measurable velocity anomaly relative to the surrounding competent dolostone. Air-filled voids show up as very low velocity zones, sometimes below 1,000 m/s. Water-filled conduits are harder to distinguish from weathered rock by velocity alone, which is why we cross-reference with borehole data and sometimes with resistivity profiling to confirm the interpretation.
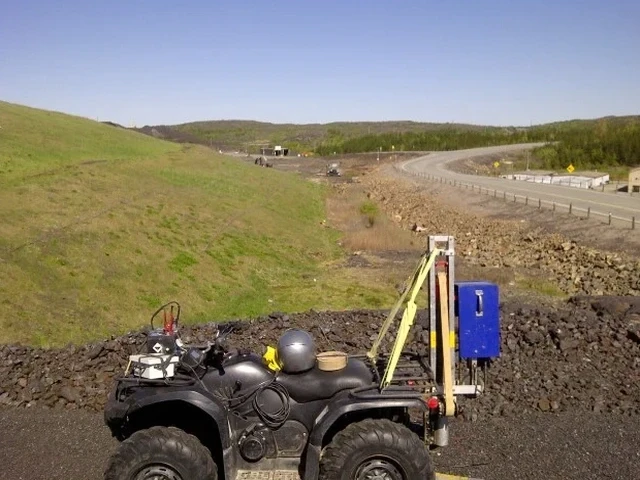
How long does a seismic survey take on site, and what access do you need?
A single refraction tomography line 70 to 100 metres long typically takes a half-day with a two-person crew, including setup, shooting, and breakdown. Combined refraction-reflection surveys take a full day. We need a relatively clear line with no major obstructions like thick concrete slabs or dense bush. Access for a pickup truck or ATV helps with transporting the seismograph and cable reels. We flag the line and use buried geophones where surface conditions allow, minimizing disruption to the site.